Key Metrics for Real Estate Forecasting Models
Forecasting errors in commercial real estate can lead to massive financial risks. Metrics like MAE, RMSE, R-squared, and the F1 Score help you evaluate the accuracy and reliability of your models. Here’s a quick breakdown:
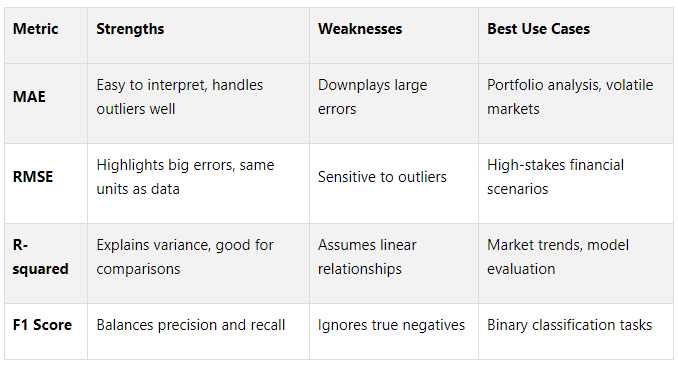
Mean Absolute Error (MAE): Measures average prediction errors in the same unit as your data, making it simple to understand. Best for general accuracy.
Root Mean Square Error (RMSE): Penalizes large errors more, ideal for high-stakes decisions.
R-squared: Explains how well your model fits the data. Great for understanding relationships but less useful for forecasting.
F1 Score: Balances precision and recall, perfect for classification tasks like predicting market downturns.
Quick Comparison Table
Key Takeaway:
Use multiple metrics together for a full picture. For example, combine MAE for clarity, RMSE for large error sensitivity, R-squared for variance, and F1 Score for classification accuracy. This ensures your forecasts align with your goals and reduce risks.
Forecasting Metrics | How To Evaluate Your Time Series Forecast
1. Mean Absolute Error (MAE)
Mean Absolute Error (MAE) is one of the simplest yet highly effective ways to evaluate real estate forecasting models. It measures the average absolute difference between predicted values and actual outcomes, providing a clear sense of how far off the forecasts are, on average. For instance, if a model predicts a property will sell for $850,000 but it actually sells for $800,000, the absolute error is $50,000. By averaging such errors across all predictions, MAE gives a single figure that reflects the model's overall accuracy.
Interpretability
One of the best things about MAE is how straightforward it is to understand. It uses the same units as the data you’re working with, whether it’s property values in dollars or rental yields expressed as percentages. For example, if a model reports an MAE of $75,000, it’s easy for stakeholders to see that, on average, predictions are off by about $75,000. This eliminates any need for complex explanations or conversions, making it simple to compare different models, time periods, or property types.
Sensitivity to Outliers
MAE is especially useful in commercial real estate forecasting because it handles outliers well. For instance, in a market where typical properties sell for around $2 million, a luxury penthouse priced at $20 million can be an extreme case. Unlike some other metrics, MAE treats all errors equally, so a few unusual predictions won’t disproportionately affect the overall results. This makes MAE a reliable way to evaluate models, even when a few properties deviate significantly from the norm.
Use Case Relevance
MAE shines in routine forecasting tasks, particularly in portfolio-level analysis. It’s a practical choice for evaluating predictions related to standard office buildings, retail spaces, or multifamily properties. By providing a consistent measure of accuracy, MAE helps fund managers and investors assess the performance of forecasting models across large property portfolios without being overly influenced by anomalies.
Alignment with CRE Objectives
In commercial real estate, decision-makers often value practical accuracy over perfection. MAE aligns with this mindset by focusing on average performance rather than rare, extreme errors. For example, if a model has an MAE of $100,000 on properties valued at around $2 million, stakeholders can interpret this as a 5% average error. This insight is invaluable for risk assessments, pricing strategies, and capital allocation. By offering actionable, easy-to-understand insights, MAE helps companies make informed decisions and set realistic expectations in a competitive market.
2. Root Mean Square Error (RMSE)
Root Mean Square Error (RMSE) emphasizes larger prediction errors by squaring them, averaging the results, and then taking the square root. Unlike Mean Absolute Error (MAE), which treats all errors equally, RMSE gives more weight to significant deviations. For example, an error of $200,000 will influence the RMSE calculation four times more than an error of $100,000. In commercial real estate forecasting, where even a single large error can lead to major financial repercussions, RMSE becomes an essential tool for evaluating model accuracy when large errors matter most.
Interpretability
One of RMSE's strengths lies in its interpretability - it’s expressed in the same units as the data itself. For instance, if a model's RMSE is $125,000, stakeholders can easily understand that, on average, predictions deviate from actual sale prices by roughly $125,000. This straightforward metric helps portfolio managers and acquisition teams quickly grasp the model’s accuracy without needing advanced statistical knowledge, aiding practical decision-making.
Sensitivity to Outliers
Because RMSE squares the errors, it’s especially sensitive to outliers. For example, if a property is predicted to sell for $10 million but actually sells for $15 million, the error's impact is greatly magnified in the RMSE calculation. While this sensitivity can highlight extreme deviations, it also serves as an important alert in financial forecasting, flagging significant errors that could carry heavy costs - critical in scenarios like underwriting acquisition loans or evaluating high-value investments.
Use Case Relevance
RMSE is particularly useful in scenarios where precision is critical to financial outcomes. Acquisition teams, lenders, and fund managers rely on RMSE to assess not only the typical accuracy of a model but also the potential impact of large errors. This makes it an indispensable metric in high-stakes forecasting environments.
Alignment with CRE Objectives
In commercial real estate, even a single large forecasting error can disrupt deals or derail investment strategies. RMSE, by penalizing models for significant inaccuracies, encourages rigorous evaluation and helps stakeholders identify risks like overvalued property assessments or unrealistic collateral valuations. Additionally, focusing on minimizing outlier errors often leads to more dependable forecasts, supporting continuous improvement in modeling and fostering confidence in decision-making. These qualities make RMSE a valuable counterpart to MAE, especially in situations where avoiding expensive outlier mistakes is critical.
3. R-squared (Coefficient of Determination)
R-squared is a statistic that measures how well a forecasting model explains the variability in property prices using its input variables. Unlike metrics like MAE (Mean Absolute Error) or RMSE (Root Mean Squared Error), which focus on the accuracy of predictions, R-squared evaluates how much of the variation in the data the model can account for.
The values for R-squared range between 0 and 1. For example, an R-squared of 0.75 means the model accounts for 75% of the variability in property prices, leaving 25% unexplained. In financial contexts, an R-squared above 0.7 typically indicates a strong correlation, while values below 0.4 suggest weaker explanatory power. This makes R-squared a useful tool for comparing the performance of different models.
To illustrate, a real estate company created a regression model to estimate house prices based on features like the number of bedrooms, square footage, and location. The model achieved an R-squared of 0.85, showing a strong relationship between these factors and property values. However, R-squared performs best with linear relationships. In more complex markets - such as luxury real estate where price increases don't scale evenly with size - it may not fully capture the model's performance. In such cases, combining R-squared with other measures, like cross-validation metrics, provides a more thorough evaluation.
For professionals in commercial real estate, R-squared helps validate assumptions and conveys the model's reliability to stakeholders. For instance, a model with an R-squared of 0.80 suggests that measurable factors explain 80% of property value changes, with only 20% attributed to random market fluctuations. However, while a high R-squared indicates a strong fit to historical data, it doesn't guarantee accurate future predictions. This is why R-squared works best when paired with error metrics like MAE and RMSE. Additionally, when comparing models, adjusted R-squared becomes crucial. It accounts for the number of predictors, helping to avoid overfitting and ensuring a more balanced evaluation.
Transform Your Real Estate Strategy
Access expert financial analysis, custom models, and tailored insights to drive your commercial real estate success. Simplify decision-making with our flexible, scalable solutions.
4. F1 Score
The F1 Score is a key metric for balancing precision and recall, especially useful in binary classification tasks like predicting above-market appreciation in real estate forecasting. While error-based metrics like MAE and RMSE focus on regression outcomes, the F1 Score shines in classification scenarios. It becomes particularly relevant when dealing with imbalanced datasets, a common challenge in real estate markets.
This score is calculated as the harmonic mean of precision and recall. Precision evaluates the proportion of correct positive predictions, while recall measures how many actual positives are identified. The F1 Score ranges from 0 to 1, with 1 indicating perfect performance and 0 the lowest.
“The F1 score is a comprehensive metric in comparison since it maximizes two competing objectives - the precision and recall scores - simultaneously.”
Use Case Relevance
The F1 Score is especially important in commercial real estate when class imbalances exist. For instance, when forecasting market downturns, periods of stability far outweigh significant declines. A model could achieve high accuracy by predominantly predicting "no downturn", but such predictions offer little value for investors. In these cases, balancing precision (correctly identifying at-risk properties) and recall (capturing most genuine cases) ensures more actionable insights for decision-making.
Interpretability
F1 scores above 0.80 are generally seen as excellent, while scores below 0.50 suggest poor performance. In many contexts, an F1 score around 0.7 may be acceptable. However, it’s worth noting that identical F1 scores can result from different combinations of precision and recall. This can obscure important performance nuances, particularly in real estate scenarios where one metric may hold more weight than the other.
Sensitivity to Outliers
While the F1 Score effectively measures classification accuracy, it has limitations. It is less sensitive to extreme price values but remains vulnerable to class imbalance. Additionally, the F1 Score does not account for true negatives. For example, accurately predicting stable property values - a critical factor in portfolio management - is not reflected in this metric.
Alignment with CRE Objectives
The F1 Score aligns well with commercial real estate goals when the costs of false positives and false negatives are relatively equal. However, in real estate, these costs are often asymmetric. Missing a profitable investment opportunity (false negative) can be more damaging than investigating an unsuitable property (false positive). To address this, use the F1 Score alongside error analysis, confusion matrices, and domain expertise to regularly adjust decision thresholds.
Advantages and Disadvantages
This section builds on the insights from individual metrics, weighing their strengths and weaknesses to help you select the right metric for different CRE scenarios.
Each metric has its own set of benefits and limitations, making them more or less suitable depending on the investment context and risk tolerance.
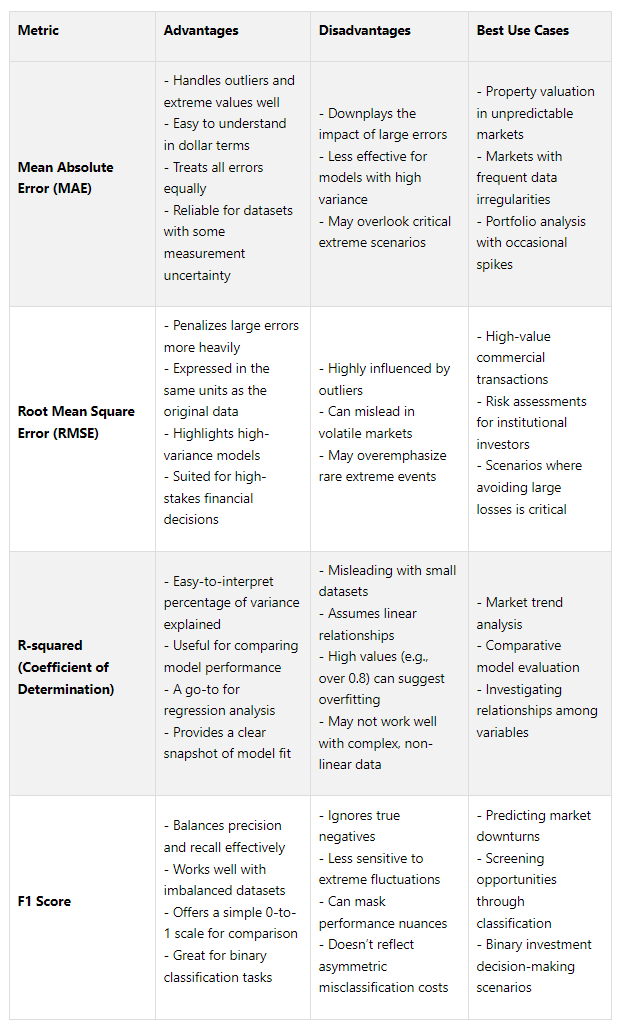
Understanding these trade-offs is key to tailoring model evaluation strategies to meet market demands.
For example, RMSE is often the go-to metric when large errors carry significant financial risks. By squaring deviations, RMSE emphasizes the cost of major miscalculations, making it ideal for high-stakes scenarios. On the other hand, MAE provides a clearer, more balanced view of performance in volatile environments, as it isn’t overly swayed by extreme outliers.
R-squared is highly interpretable but must be applied carefully in datasets with non-linear relationships. A value nearing 1.0 could indicate overfitting rather than better performance. Meanwhile, the F1 Score is a practical choice for classification tasks, though it may fall short in scenarios where missing profitable opportunities has a higher cost than false positives.
The best approach? Don’t rely on just one metric. Combining multiple metrics provides a more well-rounded evaluation, ensuring your analysis aligns with market conditions and investment strategies.
These considerations highlight why a composite evaluation approach is essential - an idea further explored in how The Fractional Analyst integrates these metrics effectively.
How CoreCast Uses These Metrics

The Fractional Analyst brings forecasting metrics to life through its CoreCast platform and hands-on expert services. By combining historical data, industry benchmarks, and user-defined assumptions, CoreCast predicts performance and identifies anomalies - like an unexpectedly low cap rate or an overly optimistic 10% rent growth in a market averaging just 2%. This blend of technology and expertise creates a foundation for real-time, data-driven insights.
“Our proven forecasting approach now powers CoreCast’s decision logic.”
CoreCast’s predictive analytics go a step further by modeling how macroeconomic factors influence portfolio returns. Its machine learning algorithms can recommend adjustments, such as revising cap rates to reflect shifting market trends in specific regions, while continuously improving forecasts as new information becomes available. For more complex cases, The Fractional Analyst employs advanced techniques like ARIMA and SARIMA models to conduct in-depth market research and underwriting. These tools enable asset managers to compare initial projections with actual results, ensuring forecast reliability through key performance metrics.
Experienced analysts complement these automated tools by refining the insights further. They validate model accuracy using R-squared values and evaluate classification performance with F1 Scores, particularly for screening investment opportunities. This hands-on approach also includes custom model development and tailored guidance for specific investment strategies.
“CoreCast transformed how we communicate portfolio performance to stakeholders. We now spend more time analyzing data, and less time assembling it.”
By integrating automation with expert analysis, CoreCast actively monitors key metrics and sends alerts when potential issues arise - like declining R-squared scores or higher RMSE values, which could indicate growing forecast uncertainty.
To support users further, free financial models and tools are available for metric-based forecasting, helping users interpret results with ease. For more advanced needs, subscription models start at $300 per user/month, with options for custom modeling and dedicated support.
Whether you’re leveraging the self-service CoreCast platform or collaborating directly with The Fractional Analyst’s team, this approach ensures that your forecasting models are continuously evaluated against industry standards, aligning with your investment goals and risk preferences.
Conclusion
Selecting the right CRE forecasting metrics hinges on understanding your data's context and the potential costs of forecasting errors. The goal is to choose metrics that offer actionable insights for stakeholders while aligning with your investment strategy and risk tolerance.
For scenarios with limited data or volatile markets, Mean Absolute Error (MAE) stands out for its clarity and ability to handle outliers effectively. On the other hand, in high-stakes situations where large errors can lead to significant financial losses, Root Mean Squared Error (RMSE) becomes crucial due to its sensitivity to major deviations. Your choice should ultimately align with your business objectives - whether it's minimizing valuation errors, explaining variance with R-squared, or balancing precision and recall using the F1 Score for classification tasks.
“With MAE and RMSE, the perfect score is 0 (The goal is to have the lowest score possible). Both values range from 0 to ∞, and depend on the scale of the target we want to forecast.”
Rather than relying on a single metric, consider using multiple measures to gain a more comprehensive evaluation of your model's performance. Combining MAE for simplicity, RMSE for error sensitivity, R-squared for understanding variance, and F1 Score for classification accuracy ensures a well-rounded assessment. This approach not only reinforces earlier insights but highlights the importance of tailoring your metrics to the specific dynamics of your portfolio and market conditions.
FAQs
-
Using several metrics like MAE, RMSE, R-squared, and F1 Score allows for a more comprehensive evaluation of real estate forecasting models. Each metric brings a unique perspective to the table, helping to paint a clearer picture of the model's performance.
MAE and RMSE focus on prediction errors, but RMSE gives more weight to larger errors, making it particularly helpful in spotting how the model deals with outliers.
R-squared measures how much of the variation in property data is explained by the model, offering a sense of its overall accuracy and reliability.
The F1 Score, though commonly used in classification tasks, assesses the balance between precision and recall. This makes it valuable for models predicting trends or categorizing risks.
Using a mix of these metrics helps you gain deeper insight into a model’s capabilities and limitations, ultimately leading to more dependable real estate forecasts.
-
When it comes to real estate forecasting, Root Mean Square Error (RMSE) is often the go-to metric. Why? Because it gives extra weight to larger errors, which can have a big impact in financial models. By penalizing these bigger deviations more heavily, RMSE ensures that models stay alert to critical missteps - something essential when high-stakes decisions are on the line.
Another reason RMSE stands out is its simplicity in interpretation. Since it measures errors in the same units as the original data, it’s much easier to understand and apply in practical situations. This is especially important in real estate financial forecasts, where accuracy directly affects risk management and return on investment.
-
The F1 Score plays a crucial role in real estate forecasting when there's a need to strike a balance between precision (how accurate the positive predictions are) and recall (how well all relevant instances are identified). This metric becomes especially valuable for classification tasks like predicting property types, occupancy statuses, or risk categories, where the consequences of false positives and false negatives can differ significantly.
Unlike traditional metrics such as Mean Absolute Error (MAE) or Root Mean Squared Error (RMSE) - which are more suited for continuous numerical predictions - the F1 Score shines in cases involving imbalanced datasets or when the costs of misclassification aren't equal. For instance, when identifying high-risk properties, misclassifying a high-risk property as low-risk (a false negative) could have far more serious consequences than the opposite error. In such cases, the F1 Score provides a balanced way to evaluate performance, ensuring both precision and recall are considered.