Time Series Models for Real Estate Forecasting
Want to predict real estate trends with confidence? Time series forecasting is your answer.
This approach uses past data to anticipate future property values, rental rates, and market cycles. Here’s what you need to know:
Why it matters: Predict seasonal patterns (e.g., summer sales spikes), economic impacts (like interest rates), and long-term trends to make smarter investment decisions.
Core models:
ARIMA: Best for trends without seasonality.
SARIMA: Handles seasonal cycles like annual sales peaks.
SARIMAX: Adds external factors like employment rates for deeper insights.
Key steps: Clean your data, ensure stationarity, and test models with metrics like MAE or RMSE.
Real-world use: Tools like The Fractional Analyst’s CoreCast platform help professionals apply these models in commercial real estate.
Time series models are powerful but work best when paired with market knowledge. Ready to forecast smarter? Let’s dive in.
Time Series Forecasting Rental Prices with FB Prophet

Core Concepts in Time Series Analysis
Grasping time series analysis is essential for accurate real estate forecasting. Below, we break down the key statistical principles, data preparation steps, and criteria for choosing effective forecasting models.
Statistical Foundations
Real estate time series data can be broken into four main components: secular trend, seasonal variations, cyclical fluctuations, and irregular noise. The secular trend reflects long-term movements in property values or market activity. Seasonal variations capture predictable patterns, like increased home sales during spring and summer. Cyclical fluctuations mirror broader economic cycles, such as periods of growth or recession, while irregular noise accounts for random, unpredictable events.
A crucial concept in time series analysis is stationarity. A stationary time series maintains consistent statistical properties, such as mean and variance, over time. Since real estate data often shows upward trends (e.g., property values appreciating), it’s necessary to transform it into a stationary format for accurate predictions. Techniques like differencing, detrending, and deseasonalizing help achieve this.
Autocorrelation, another key concept, measures how current values relate to past values. For instance, rental rates this month may strongly depend on rates from previous months. Recognizing seasonality - such as annual peaks in residential sales during warmer months or commercial lease renewals at fiscal year-end - helps models account for these patterns instead of misinterpreting them as noise.
With these concepts in mind, the next step is preparing your real estate data for analysis.
Data Preparation for Real Estate Forecasting
High-quality data is the foundation of reliable forecasting. In a study of Hong Kong flat prices from 2003 to 2019, Indraneel Dutta Baruah found that incomplete datasets - such as one with 4,233 records instead of the expected 6,173 - can significantly distort results.
“Thus, how well we clean and understand the data has a tremendous impact on the quality of the results.”
Handling missing values is crucial in real estate data. Basic methods like forward-fill, backward-fill, or linear interpolation can work, but more advanced approaches - like K-Nearest Neighbors or regression-based predictions - are often better suited to complex datasets.
Outlier detection and treatment is equally important. Market anomalies, such as unusual sales or disruptions, can create spikes that skew analysis. In the Hong Kong study, outliers were identified using the interquartile range (IQR) method, replaced with nulls, and later filled using linear interpolation to maintain data integrity.
When combining data from various sources, ensure uniform timestamp alignment. Additionally, techniques like differencing, decomposition, or moving averages help remove trends when forecasting short-term fluctuations around a long-term trajectory.
Once your data is clean and ready, the focus shifts to selecting the right forecasting model.
Model Selection Criteria
Choosing the best forecasting model requires balancing accuracy, complexity, and practical considerations. Start by understanding your data and forecasting objectives.
Begin with simpler models like AR (Auto-Regressive) or MA (Moving Average). If your data shows clear seasonal trends, more advanced models like SARIMA (Seasonal ARIMA) or seasonal decomposition may be appropriate.
Evaluation metrics play a key role in assessing model performance. Metrics like Mean Absolute Error (MAE) provide a straightforward measure of prediction errors, while Root Mean Squared Error (RMSE) penalizes larger errors more heavily. Mean Absolute Percentage Error (MAPE) expresses accuracy as a percentage, making it easier to interpret for stakeholders.
Since time series data can’t be split randomly, cross-validation techniques like rolling window validation or walk-forward validation are used. These methods simulate real-world forecasting by training on past data and testing on future periods.
Finally, incorporating domain knowledge is essential. Understanding factors like interest rate changes, seasonal buying behaviors, or local economic trends ensures your model reflects real-world market dynamics. Practical considerations - such as the volume of data, forecast horizon, and update frequency - also influence your choice of model.
Time Series Models for Real Estate Forecasting
This section dives into the key models used for real estate forecasting, building on statistical groundwork and prepared data. From basic approaches like ARIMA to more advanced seasonal models and newer methodologies, each model offers unique advantages depending on the scenario. Let’s break down how these models work and when they’re best applied.
ARIMA: Autoregressive Integrated Moving Average
ARIMA is a go-to model for forecasting real estate trends, capturing both patterns and short-term changes in property values, rental rates, and market activity.
The model’s structure is defined by three components - Autoregressive (AR), Integrated (I), and Moving Average (MA) - each represented by parameters (p, d, q). Here’s how they work:
Autoregressive (AR): Uses past values to predict future trends.
Integrated (I): Addresses non-stationary data by applying differencing.
Moving Average (MA): Accounts for past forecast errors.
For example, p refers to the number of AR terms, d is the number of differencing steps needed, and q represents the MA terms. Analysts often rely on tools like Autocorrelation Function (ACF) and Partial Autocorrelation Function (PACF) plots to fine-tune these parameters.
ARIMA’s appeal lies in its straightforward design, making it a solid choice for commercial real estate markets where seasonal trends aren’t dominant. However, it does assume stationarity, so non-stationary datasets need pre-processing through differencing.
SARIMA: Seasonal ARIMA
When seasonal patterns are part of the equation, SARIMA steps in as an enhanced version of ARIMA. Real estate markets often show recurring trends - residential sales peak in spring and summer, while commercial leases may renew around fiscal year-end. SARIMA incorporates seasonal elements into its framework, adding parameters (P, D, Q, s) alongside the non-seasonal (p, d, q) components. Here:
P, D, Q: Address seasonal autoregressive, differencing, and moving average terms.
s: Represents the seasonal period (e.g., s = 12 for monthly data with yearly cycles).
Research shows SARIMA typically performs better than ARIMA when seasonal cycles are strong. However, it requires several years of consistent data to estimate parameters accurately. While SARIMA is ideal for forecasting residential sales or retail property trends with clear seasonal patterns, it’s less suitable for markets without such cycles.
Advanced Models and New Approaches
For more complex scenarios, advanced models like SARIMAX (Seasonal ARIMA with eXogenous variables) take forecasting further. SARIMAX builds on SARIMA by integrating external factors - such as interest rates, employment statistics, or other economic indicators - that influence real estate markets. This addition allows analysts to create forecasts that go beyond historical trends, offering deeper insights into market dynamics.
Choosing the right model depends on your data and goals. If ARIMA struggles to handle complex datasets, SARIMA or SARIMAX might be better options. However, these models require more processing power and time, especially with larger datasets or frequent updates. For simpler, short-term predictions, ARIMA might suffice. But for multi-step or long-term forecasts, SARIMA and SARIMAX are often better suited, especially when strategic planning is involved.
Ultimately, combining these statistical tools with real estate expertise ensures forecasts align with market realities, rather than relying solely on past data. This blend of methods and insights helps create forecasts that are both actionable and reflective of actual market behaviors.
How to Implement and Evaluate Time Series Models
Building on the statistical concepts discussed earlier, this section walks you through the practical steps of implementing and evaluating time series models. By following a structured approach, you can turn raw real estate data into reliable forecasts.
Step-by-Step Implementation Process
A successful time series model begins with data collection and preparation. For real estate forecasting, you’ll need at least 2–3 years of monthly data to capture meaningful patterns and seasonal trends. This dataset might include property values, transaction volumes, or rental rates.
Next comes data cleaning, which is critical for accuracy. Remove anomalies and fill in missing values using methods like interpolation. Research indicates that poor data quality contributes to around 62% of forecasting errors, while companies with strong data quality measures can reduce error rates by 37%.
Exploratory data analysis (EDA) is the next step. Visualize your data to uncover trends, seasonal fluctuations, and outliers. For example, residential sales often peak during spring and summer, reflecting cyclical behavior.
Ensure your data is stationary, as this is essential for valid modeling. Use visual tools and statistical tests to check stationarity. If trends or changing variances are present, apply transformations like differencing to stabilize the data.
When choosing a model, match it to your data’s characteristics. For datasets with trends but little seasonality, ARIMA is a solid choice. If strong seasonal patterns are present, SARIMA is better suited. For more complex scenarios, SARIMAX can incorporate external factors like interest rates or employment figures.
The parameter estimation phase involves selecting the best (p, d, q) values for ARIMA or (P, D, Q, s) for SARIMA. Tools like Autocorrelation Function (ACF) and Partial Autocorrelation Function (PACF) plots, along with metrics like AIC, can guide this process.
Finally, generate forecasts with point estimates and confidence intervals to account for uncertainty. Regularly update your forecasts to maintain their relevance.
Once your model is built, the next step is to evaluate its performance thoroughly.
Performance Evaluation Methods
Evaluating your model’s accuracy is crucial for understanding its effectiveness and identifying areas for improvement. Here are some commonly used metrics:
Mean Absolute Error (MAE): Measures the average error magnitude between actual and predicted values. It’s straightforward to interpret since it uses the same units as the original data.
Root Mean Squared Error (RMSE): Takes the square root of the average squared errors, giving more weight to larger errors. This is especially useful in real estate, where significant errors can have a big financial impact.
Mean Absolute Percentage Error (MAPE): Expresses errors as percentages, making it easier to compare performance across different markets or property types. However, it’s less reliable when actual values are very small or zero.
For example, a study on NYC property sales (2003–2015) used Prophet to forecast data from the NYC Department of Finance. Analysts achieved a MAPE of about 8% for one-month-ahead predictions and 10% for one-year-ahead forecasts, demonstrating clear seasonal trends with higher sales in the summer.
Out-of-sample testing is another critical step. Split your data into training and testing sets, reserving 20–30% of the most recent data for testing. This method simulates real-world forecasting scenarios. You can also use time series cross-validation, which involves multiple training and test sets, for a more thorough evaluation. Combine these numerical methods with visual tools, like time series and error plots, to spot patterns in forecast errors.
Model Comparison
Choosing the right model depends on your specific data and forecasting needs. Here’s a comparison to guide your decision:
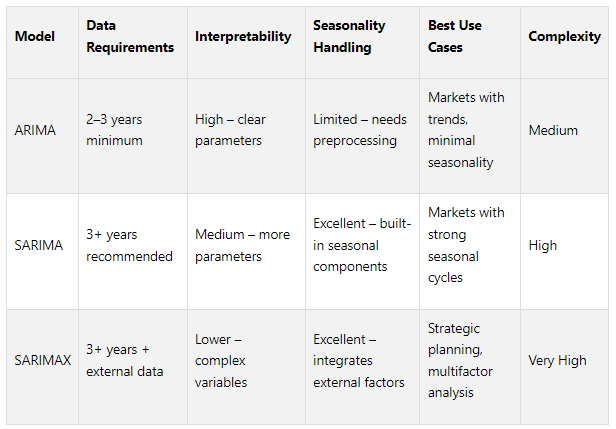
ARIMA works well for straightforward cases where trends dominate and seasonal effects are minimal. SARIMA is better for markets with clear seasonal cycles but requires more data and a more complex setup. SARIMAX adds the ability to incorporate external variables, making it ideal for comprehensive, strategic forecasting - though it demands more effort in data preparation.
Ultimately, the key is to match model complexity to your data and goals. Businesses that leverage time series forecasting see growth rates 19% higher than those relying on intuition alone. Regular validation and updates will keep your forecasts aligned with changing market conditions.
Transform Your Real Estate Strategy
Access expert financial analysis, custom models, and tailored insights to drive your commercial real estate success. Simplify decision-making with our flexible, scalable solutions.
Real Estate Applications of Time Series Models
Time series models transform complex market data into insights that help real estate professionals make smarter investment decisions. Agents, developers, and investors depend on these models to predict future trends, allowing them to act with confidence and precision. By uncovering cyclical patterns and quantifying market dynamics, these models offer a distinct advantage in evaluating investment opportunities.
Improving Investment Decisions
Time series models enhance real estate investment strategies in three key ways: they fine-tune market timing, minimize risks, and improve portfolio management by identifying long-term market cycles.
Market timing becomes more accurate with the help of statistical tools. These models identify cycles that signal the best times to buy or sell properties.
Risk assessment benefits from improved predictive accuracy. For example, a study using machine learning and big data to forecast real estate returns found that an XGBoost model reduced forecasting errors by 68% compared to simple regression models and by 26% compared to multivariate regression models. This model also successfully identified early warning signs of downturns during the 2000 and 2008 recessions.
Portfolio optimization relies on insights into long-term market cycles. By analyzing historical data, investors can spot patterns and trends, enabling them to diversify holdings across property types and regions based on anticipated performance. Predictive analytics, combined with machine learning, can refine forecasts by accounting for variables like location, economic trends, interest rates, and population changes. Public REIT returns, which reflect investor sentiment in real-time, often serve as early indicators of private real estate performance.
These benefits highlight how time series models can directly enhance investment strategies, as seen in the tools and services offered by The Fractional Analyst.
How The Fractional Analyst Uses Time Series Analysis

The Fractional Analyst demonstrates how time series models can be applied in real-world scenarios. By integrating these methodologies into its analyst services and its CoreCast platform, the company provides valuable forecasting tools for commercial real estate professionals.
The Fractional Analyst utilizes ARIMA, SARIMA, and machine learning models for market research and underwriting. Its CoreCast platform offers automated forecasting at $50/month during beta testing and $105/month post-launch. These tools allow asset managers to compare initial assumptions with actual outcomes, making it easier to adjust forecasts as market conditions change.
For unique or complex market scenarios, The Fractional Analyst offers custom model development and private instruction. This ensures that time series techniques can be tailored to specific investment strategies and market conditions.
Combining Statistical Analysis with Market Knowledge
While time series models excel at identifying data patterns, combining these insights with market expertise takes forecasting to the next level. Statistical models reveal trends and relationships, but understanding the broader market context is essential for accurate interpretation.
Economic and demographic factors play a crucial role in refining forecasts. For instance, a time series model might detect rising multifamily rents, but a seasoned professional might also consider factors like supply constraints or potential policy changes that could alter the trajectory.
Local market knowledge is equally important. For example, a drop in days on market might indicate strong demand - or it could simply reflect seasonal fluctuations.
“The housing market is a complex and dynamic system, with many factors influencing its performance... Time series forecasting is a powerful tool that can help predict future trends in the housing market by analyzing historical data and identifying patterns.”
Research also shows that univariate models perform better for short-term forecasts, while multivariate models are more effective over longer timeframes. Selecting the right external variables - such as interest rates, employment levels, and demographic trends - requires both statistical expertise and market insight, as their impact varies depending on property type, location, and market cycle phase.
Conclusion
Time series models play a crucial role in real estate forecasting. They enable accurate predictions of property values, rental income, and market cycles, which are essential for making informed investment decisions. By analyzing historical data, these models uncover patterns and subtle trends, offering a solid framework for data-driven strategies.
But relying solely on numbers isn’t enough. Effective forecasting requires blending statistical analysis with a deep understanding of the market. Combining time series insights with knowledge of economic indicators, demographic trends, and regulatory shifts allows for a more comprehensive interpretation of the data. This mix of quantitative methods and qualitative expertise leads to stronger, more actionable predictions.
“Housing is one of the most important components of U.S. economic performance.”
The Fractional Analyst highlights how these models can be applied in real-world scenarios. With services like its CoreCast platform and direct analyst support, the company showcases how statistical tools and market insights come together to enhance commercial real estate forecasting. This approach equips professionals with both the technology and expertise needed to make smarter, more informed decisions.
FAQs
-
ARIMA and SARIMA are two key models used in time series analysis to predict future trends based on historical real estate data. ARIMA (AutoRegressive Integrated Moving Average) works by identifying patterns in past data, combining autoregressive and moving average elements to forecast future values. SARIMA (Seasonal ARIMA) takes this a step further by factoring in seasonal patterns, making it especially handy for markets with predictable cycles, like quarterly or yearly fluctuations.
These models are invaluable for real estate professionals looking to anticipate market shifts. They support smarter investment strategies and more precise financial planning. By applying these tools, analysts can better understand market dynamics and effectively manage the challenges of the real estate sector.
-
Preparing Real Estate Data for Time Series Forecasting
Getting real estate data ready for time series forecasting starts with ensuring it’s accurate, complete, and well-organized. Begin by gathering reliable and relevant data from trustworthy sources. Pay close attention to consistency in units, timestamps, and data formats to avoid discrepancies.
Once collected, the next step is to clean and preprocess the data. This includes handling missing values, eliminating outliers, and double-checking that all timestamps are correctly aligned. These steps are essential for identifying meaningful market trends and patterns. A well-prepared dataset is the backbone of dependable forecasts and informed decision-making in the real estate market.
-
External factors like employment rates and interest rates can play a crucial role in time series models when used as exogenous variables. These factors reflect broader economic conditions that directly influence real estate trends, including property demand, pricing, and investment behavior.
Incorporating indicators such as job growth, inflation, or shifts in borrowing costs makes these models more grounded in economic reality. This approach helps analysts produce forecasts that better reflect actual market dynamics, enabling stakeholders to navigate the constantly shifting real estate landscape with greater confidence.